Social media metrics: history import and brand goals
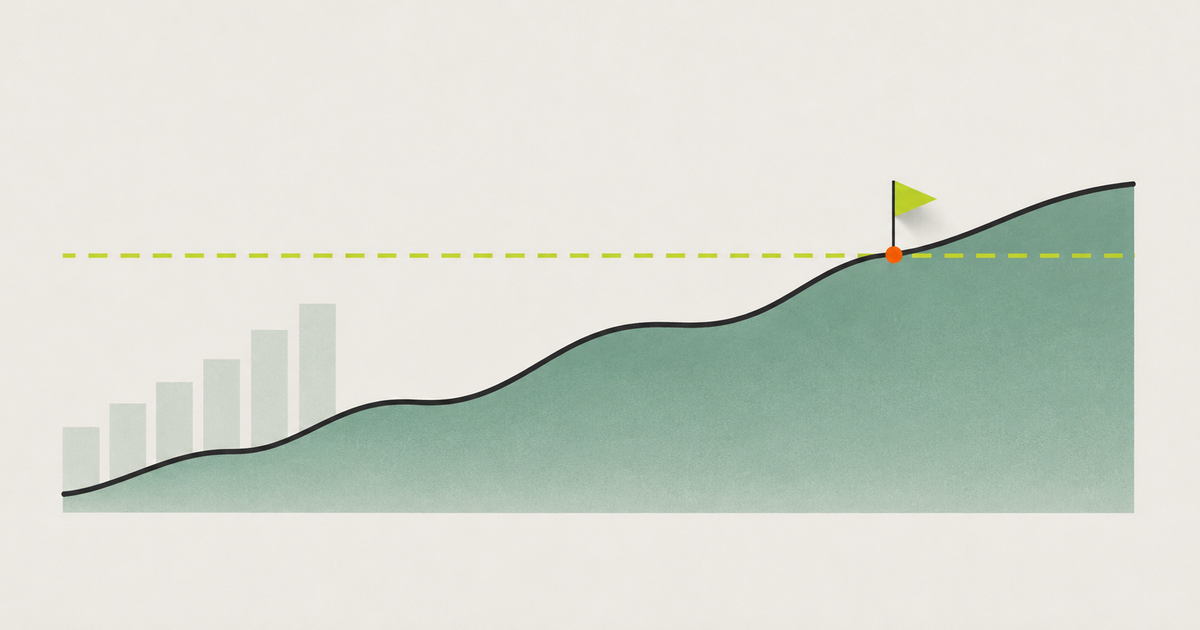
Zynta Insights shows, for each brand, what happened and whether it is on pace for the goal you set. Metrics come from your connected networks, and Instagram history can be imported on day one. Here is how each part works and what it doesn't do yet.
The problem with starting without history
A new analytics tool usually starts with an empty dashboard. Numbers only show up from that day forward, so comparing with the previous month means waiting a month. With clients, that hurts: the first report goes out with no baseline.
The second problem is that a number without a goal tells you nothing. Are 1,000 views in a week good or bad? It depends on what the brand wanted. I wanted to solve both in one place. For a broader view of what to measure, see the social media metrics that matter.
What does Insights show?
Insights sits in the Zynta menu and shows the brand selected at the top. It has fixed tabs for all networks together, for everything since the start, and for Instagram, LinkedIn, TikTok and HubSpot. You can look at 7, 30 or 90 days, this month, last month, all time or a custom date range.
The main numbers per network:
- Instagram: posts, likes, comments, engagement per post, engagement rate, interactions, total reach, profile visits, followers gained from posts, saves and shares. For Reels, watch time and skip rate.
- LinkedIn company page: followers, new followers, impressions, clicks, engagement rate and visits.
- LinkedIn personal profile: the LinkedIn API does not give apps any personal profile metrics, so Zynta reads the export file you download from LinkedIn (impressions, members reached, engagements and followers).
- TikTok: followers, total likes, posts, average views per post and engagement per view.
Each published post also shows its own metrics in the calendar, with a button to refresh them.
How the history import works
The paid import is Instagram only. It brings in your last 50 posts, with likes, comments, reach, saves, shares and views, and fills in up to 90 days of daily account numbers. It costs 20 credits, charged only if something gets imported.
You can run it in three ways:
- In the brand setup wizard, right after you connect the first network. That first time, for an account that has no metrics yet, it is free.
- From the notice that appears in Insights offering to bring in your last 50 posts, using its import button (20 credits).
- In the Instagram tab, with the Import IG posts button (20 credits).
If you import again for the same brand within an hour, you don't pay twice. One caveat: some daily Instagram account metrics can't be recovered later, so a day with no collection stays empty.
Daily tracking
The brand kit has an option to track metrics every day. It is off by default and costs up to 1 credit per connected account per day. Accounts on the free plan are not charged for it. It keeps your history growing without you opening Zynta.
How do goals work for each brand?
Goals live in the brand kit, in the goals section. You add a goal, choose the metric, the period and the number, and save. The available metrics are:
- Net followers (gained minus lost)
- Views
- Interactions
- Posts published
The period can be weekly (Monday to Sunday) or monthly. Each metric gets one goal per period.
In Insights, a card above the tabs shows each goal with one of four statuses: goal reached, on pace, off pace or no data. The pace math is simple: Zynta divides the goal by the days in the period and compares it with the days already gone, not counting today. If you are at 90% or more of the expected value, you are on pace. It also projects where you'll end the period at the current rate. Only the brand owner and editors can change goals.
Leads can't be a goal for now.
Analysis and client report
With the numbers on screen, the Write the analysis button produces a text in three parts: what worked, what to change and the next steps. It costs 15 credits and is saved per brand, period and language.
The client report puts together a report for the brand, goals included, for 25 credits. In the brand kit you can turn on an automatic report on the 1st of every month.
Step by step
- In your brand kit, turn on daily tracking and create your goals.
- Open Insights and choose the tab and the period.
- In the Instagram tab, run Import IG posts if you have no history yet.
- For a written read of the numbers, click Write the analysis.
- At the end of the month, open the client report.
The limits
- The paid history import is Instagram only: the last 50 posts plus up to 90 days of account data, not 90 days of every post.
- LinkedIn personal profiles depend on the LinkedIn export file.
- There is no leads goal.
- Daily data that Instagram does not keep can't be brought back later.
With clients, goals and the report work well together. The client sees the number and sees whether it is on the agreed pace, which avoids the "is this good?" conversation.
Frequently asked questions about Zynta Insights
What is Zynta Flow Insights?
It is the metrics area of Zynta, organized by brand. It brings together Instagram, LinkedIn and TikTok numbers over the periods you choose, shows how each post performed, tracks weekly or monthly goals, and can write a text analysis or build a report for your client.
Does Zynta import my old Instagram history?
Yes. The import brings in your last 50 posts with likes, comments, reach, saves, shares and views, and fills in up to 90 days of daily account numbers. It costs 20 credits and is free during the first setup of an account that has no metrics yet.
Which goals can I set for a brand?
Net followers, views, interactions and posts published, each one weekly or monthly. Zynta shows whether the goal was reached and whether you are on pace or off pace, comparing your result with the part of the period that has already passed, and it projects where the period will end.
How does Zynta calculate whether I'm on pace for a goal?
It divides the goal by the days in the period and multiplies by the days already gone, not counting today. If your current result reaches at least 90% of that expected value, the goal shows as on pace. Below that, it is off pace. Once you hit the full number, the goal is reached.
How much does it cost to use Zynta Insights?
Viewing your metrics costs nothing. The Instagram history import costs 20 credits, the text analysis costs 15, the client report costs 25, and the optional daily tracking costs up to 1 credit per connected account per day. Accounts on the free plan don't pay for daily tracking.
Does Zynta show metrics for my personal LinkedIn profile?
Yes, using the export file you download from LinkedIn itself, because the LinkedIn API does not give apps any personal profile metrics. For LinkedIn company pages, Zynta pulls the numbers straight from the API instead: followers, impressions, clicks, engagement and visits.
Zynta Insights or the native Instagram dashboard: which should I use?
The native dashboard shows one account at a time and has no goals. Zynta Insights brings the brand's networks together, compares periods, tracks goals and builds a report for the client. If you look after a single account and don't report to anyone, the native dashboard may be enough.
Put this into practice
Want to see your brand's history on day one? Start the 7-day trial and import your last 50 Instagram posts.
Start the 7-day trial